TLDR
• Core Points: Relying on a single dashboard can mask user-experience issues; a triad approach—APM, RUM, and DEM—offers a complete view of performance.
• Main Content: Integrating server-side monitoring (APM), client-side visibility (RUM), and end-to-end journey analysis (DEM) reveals hidden bottlenecks across the tech stack.
• Key Insights: Real user performance data, synthetic and real-world monitoring, and journey instrumentation are essential for diagnosing slowdowns and failures.
• Considerations: Align across teams, manage data privacy, and balance telemetry volume with signal quality.
• Recommended Actions: Implement an integrated monitoring strategy combining APM, RUM, and DEM, establish baselines, and start tracing across layers.
Content Overview
In modern web architectures, a healthy-looking dashboard can be misleading. Lights may be green, and response times within historical norms, yet users still encounter slow pages or broken flows. This discrepancy arises because many monitoring tools focus on a single layer of the stack—typically the server. When the server appears fast, issues at the client, network, or application level can go undetected, resulting in support tickets and frustrated users.
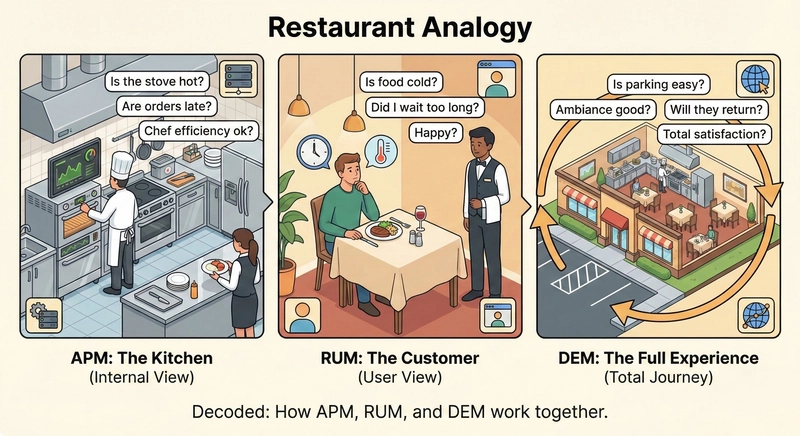
To truly understand application performance, teams must adopt a triad monitoring approach that examines three complementary perspectives: the server (Application Performance Monitoring, or APM), the user (Real User Monitoring, or RUM), and the end-to-end journey (Digital Experience Monitoring, or DEM). Each angle provides unique signals that, when combined, offer a comprehensive view of the user experience and the health of the system.
APM emphasizes code-level performance, database interactions, and server resources. RUM collects data from actual user interactions in the browser or app, capturing metrics like load time, interaction latency, and error rates from real sessions. DEM traces the user journey from start to finish, correlating frontend events with backend calls and infrastructure signals, enabling cross-layer root-cause analysis. Together, these components help teams identify bottlenecks that would be invisible if they relied on a single monitoring paradigm.
This article examines how the APM–RUM–DEM framework can help organizations move from reactive maintenance to proactive performance management. It outlines the roles of each component, common pitfalls of isolated monitoring, and practical steps for implementing an integrated strategy. By the end, readers will understand why the trinity is necessary, how to operationalize it, and what outcomes to expect in terms of user satisfaction, engineering velocity, and operational resilience.
In-Depth Analysis
The traditional approach to monitoring often centers on server health metrics: CPU usage, memory consumption, database query latency, and error rates. While these indicators are essential, they do not necessarily reveal how end users experience the application. A fast server does not guarantee a fast, reliable experience if the client-side rendering is heavy, if third-party scripts block the main thread, or if the network path introduces delays. In other words, server performance and user experience can decouple under certain conditions, leading to misleading dashboards.
APM focuses on internal code paths and backend performance. It helps identify slow functions, inefficient queries, and resource contention within services. It excels at pinpointing where the server spends most of its time and which components contribute to latency. However, APM typically relies on instrumentation within the application and may not reflect how users interact with the system or how external dependencies perform in real user scenarios.
RUM captures performance data from actual user sessions as they interact with the application. It provides metrics such as page load time, time to interactive, first contentful paint, error rates, and user gestures—collected from the real devices, networks, and environments in which users operate. RUM is invaluable for understanding the real-world impact of changes, especially across diverse geographies and device types. The downside is privacy considerations and the challenge of distinguishing between network-induced delays and client-side inefficiencies without server-side context.
DEM, sometimes described as end-to-end experience monitoring, combines signals from APM and RUM with traces and metrics that link frontend events to backend requests and infrastructure behavior. DEM enables cross-layer correlation, allowing teams to answer questions like: Which backend service is responsible for a user-perceived slowdown on a specific page? How do third-party dependencies or API calls influence the user journey? How does a failed checkout flow propagate across services and devices? DEM provides the context necessary to diagnose complex performance issues that span the entire stack.
Several practical benefits emerge from this triad approach:
– Faster root-cause analysis: Correlating user-perceived delays with backend traces helps identify whether issues arise from rendering, scripting, network, or server processing.
– Improved change risk management: Before rolling out code changes, teams can simulate or observe how the end-to-end experience would respond under real-world conditions.
– Better prioritization: Understanding the impact on user journeys helps teams prioritize fixes that affect business outcomes, such as checkout performance or first-input delay.
Despite these benefits, integrating APM, RUM, and DEM presents challenges:
– Data silos: Different teams might own different monitoring domains, leading to fragmented visibility.
– Data volume and privacy: RUM and full-fidelity traces generate significant data; organizations must balance insights with privacy and cost considerations.
– Instrumentation overhead: Adding instrumentation can affect performance if not carefully implemented; sampling strategies and adaptive dashboards can mitigate this risk.
– Tool compatibility: Not all monitoring tools expose seamless integration points across APM, RUM, and DEM; careful vendor evaluation or custom integration may be required.
To implement an effective APM–RUM–DEM strategy, organizations should consider the following steps:
1) Define what “good performance” means for the business. Establish user-centric SLOs (service level objectives) tied to critical journeys, such as product search, cart, and checkout.
2) Map user journeys end-to-end. Identify key milestones and dependencies across frontend code, API gateways, microservices, databases, and third-party services.
3) Instrument across layers with a coherent data model. Ensure that timestamps, trace identifiers, and correlation IDs flow consistently from the client to the server and back into the user’s browser.
4) Use synthetic monitoring alongside real-user data. Synthetic tests can provide continuous, controllable baselines; RUM validates those baselines against real users.
5) Establish dashboards that unify signals. Create views that show end-to-end journey performance, cross-referencing frontend metrics with backend traces and infrastructure signals.
6) Implement alerting that reflects user impact. Alerts should be actionable and aligned with business impact, not just technical thresholds.
7) Institute a feedback loop. Use incidents as learning opportunities to refine instrumentation, baselines, and response playbooks.
A practical architecture might involve:
– APM components instrumenting server-side code, database queries, and message queues.
– RUM instrumentation embedded in the web or mobile app to capture user-perceived performance, errors, and network latency.
– DEM orchestrating correlation across traces, linking frontend events to backend transactions, and aggregating metrics from cloud infrastructure and third-party services.
– A data platform that stores and harmonizes telemetry, supports querying across dimensions (time, geography, device, user segment), and powers machine-learning-driven anomaly detection and root-cause analysis.
When evaluating the impact of changes, the integrated model enables teams to determine not only whether a change degraded performance on a given metric but also which user journeys were affected. For example, a new checkout microservice might reduce server latency in isolation but increase the time-to-interaction for users on slower networks due to increased frontend processing. DEM would reveal the end-to-end chain of events—from the initial click to the final server response—and highlight where latency accumulates.
Operationally, adopting the APM–RUM–DEM triad requires governance and cross-team collaboration. SREs, frontend engineers, backend developers, product managers, and data/privacy officers must align on data collection policies, privacy constraints (such as PII handling in RUM), and incident response processes. A shared language and consistent data contracts facilitate faster analysis and faster restorations when problems arise.

*圖片來源:Unsplash*
Future trends in performance monitoring reinforce the value of this triad. Advances in distributed tracing, smart sampling, and edge computing will enhance visibility into how content delivery networks and edge services influence the user experience. AI-assisted anomaly detection and auto-correlation can reduce mean time to detect (MTTD) and mean time to resolve (MTTR), while continuous verification tests validate that performance remains within expected bounds as software evolves.
Ultimately, the goal of moving beyond the dashboard is not merely to collect more data but to gather the right signals that allow teams to act quickly and effectively. The APM–RUM–DEM framework provides a structured approach to understanding performance from the perspective of the system and the user, enabling organizations to deliver faster, more reliable experiences that drive engagement and business success.
Perspectives and Impact
Real-world adoption of APM, RUM, and DEM often reveals a multi-layered impact on both operations and product development. On the operations side, the triad reduces cycle times for diagnosing issues, enabling faster restoration of service and more precise capacity planning. With end-to-end visibility, teams can distinguish between systemic performance degradations and transient blips, avoiding alert fatigue and focusing on issues that matter to users.
From a product perspective, understanding how users experience a site or app across devices, networks, and geographies informs prioritization. Feature changes can be validated in terms of their impact on key journeys, helping product teams balance innovation with reliability. For example, if a new recommendation engine improves server efficiency but slows down page rendering on devices with limited processing power, DEM analysis can surface the trade-off and guide optimization efforts.
The future of this triad includes deeper integration with privacy-preserving telemetry and the broader observability ecosystem. Privacy-preserving data collection techniques, such as data minimization, anonymization, and selective sampling, play a critical role in maintaining user trust while retaining diagnostic value. As organizations increasingly adopt cloud-native architectures, cross-cloud and multi-region visibility will become more essential, necessitating robust data correlation and time-synchronization practices.
Organizations that invest in APM, RUM, and DEM also benefit from greater resilience. By continuously monitoring end-to-end performance and alerting on user-impacting deviations, teams can detect issues before they escalate into customer-visible outages. This proactive stance supports smoother releases, fewer incidents, and better adherence to service-level commitments. The resulting improvements in user satisfaction and retention can have a pronounced positive effect on the business.
However, achieving these gains requires disciplined implementation. Without clear ownership, well-defined data governance, and consistent instrumentation, the triad can become another set of dashboards that fail to deliver actionable insight. Leaders must champion an integrated culture of observability, invest in training for engineers across disciplines, and establish repeatable playbooks for incident response and post-incident reviews.
In the broader tech landscape, the APM–RUM–DEM framework aligns with shifts toward customer-centric engineering and performance as a feature. As applications become more complex and user expectations rise, the ability to diagnose and optimize performance across the entire journey will differentiate organizations that deliver reliably fast experiences from those that struggle with sporadic slowdowns and frustrated users.
Key Takeaways
Main Points:
– A single dashboard often obscures user-perceived performance issues; a triple perspective is essential.
– APM, RUM, and DEM collectively provide end-to-end visibility across server, client, and journey contexts.
– Cross-layer correlation enables faster root-cause analysis and more business-focused improvements.
Areas of Concern:
– Data silos and cross-team coordination gaps can hinder effective implementation.
– Privacy, data volume, and instrumentation overhead require careful management.
– Tool compatibility and integration complexity may slow adoption without a clear plan.
Summary and Recommendations
To transform performance monitoring from reactive dashboards to proactive, business-oriented observability, organizations should implement an integrated APM–RUM–DEM strategy. Start by defining business-relevant SLOs tied to critical user journeys, and map the end-to-end path from user action to backend processing. Instrument consistently across layers to enable reliable correlation, and combine real-user data with synthetic monitoring to establish robust baselines.
Develop unified dashboards that present cross-layer signals in the context of user journeys, and implement alerting that prioritizes user impact. Address privacy and data-management concerns by applying appropriate data governance and privacy controls, while optimizing telemetry collection to balance signal quality with cost.
Fostering collaboration across SREs, developers, product managers, and privacy officers is vital. Establish clear ownership, data contracts, and incident response playbooks to realize the full benefits of the triad. As technology stacks continue to evolve, the APM–RUM–DEM framework will remain a cornerstone of resilient, user-centric performance management, enabling organizations to deliver faster experiences, improve reliability, and drive growth.
References
- Original: https://dev.to/manageengineapm/beyond-the-dashboard-decoding-the-apm-rum-and-dem-trinity-3539
- Additional references (for context):
- Introduction to APM, RUM, and DEM concepts: https://www.elastic.co/what-is-apm
- Real User Monitoring explained: https://www.cloudflare.com/learning/ddos/glossary/real-user-monitoring-rum/
- End-to-end visibility and DEM concepts: https://www.ibm.com/cloud/learn/digital-experience-monitoring

*圖片來源:Unsplash*